Imaging artifacts#
Note
To ensure accuracy and avoid introducing ailiasing artifacts, the input data should be at least Nyquist sampled when applying imaging artifacts via convolution.
Smear#
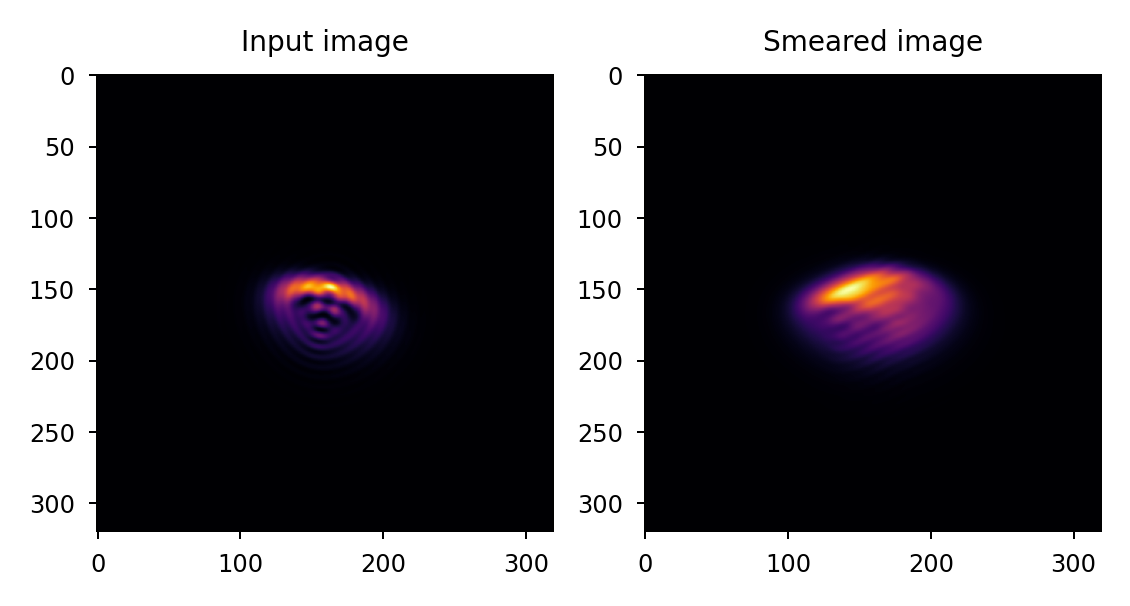
Smear is used to represent image motion with a relatively low temporal frequency relative
to integration time. The motion occurs in a slowly varying or fixed direction over one
integration time. Lentil’s smear() method represents smear as a linear
directional blur over some distance (or number of pixels):
>>> import lentil
>>> import matplotlib.pyplot as plt
>>> psf = ...  # PSF calculation details omitted
>>> psf_smear = lentil.smear(psf, distance=5e-5,
...                          pixelscale=5e-6,
...                          oversample=5)
>>> plt.subplot(121), plt.imshow(psf, cmap='inferno')
>>> plt.subplot(122), plt.imshow(psf_smear, cmap='inferno')
As an alternative to specifying physical distance and pixelscale, a number of pixels can also be provided:
>>> import lentil
>>> import matplotlib.pyplot as plt
>>> psf = ...  # PSF calculation details omitted
>>> psf_smear = lentil.smear(psf, distance=10,
...                          oversample=5)
>>> plt.subplot(121), plt.imshow(psf, cmap='inferno')
>>> plt.subplot(122), plt.imshow(psf_smear, cmap='inferno')
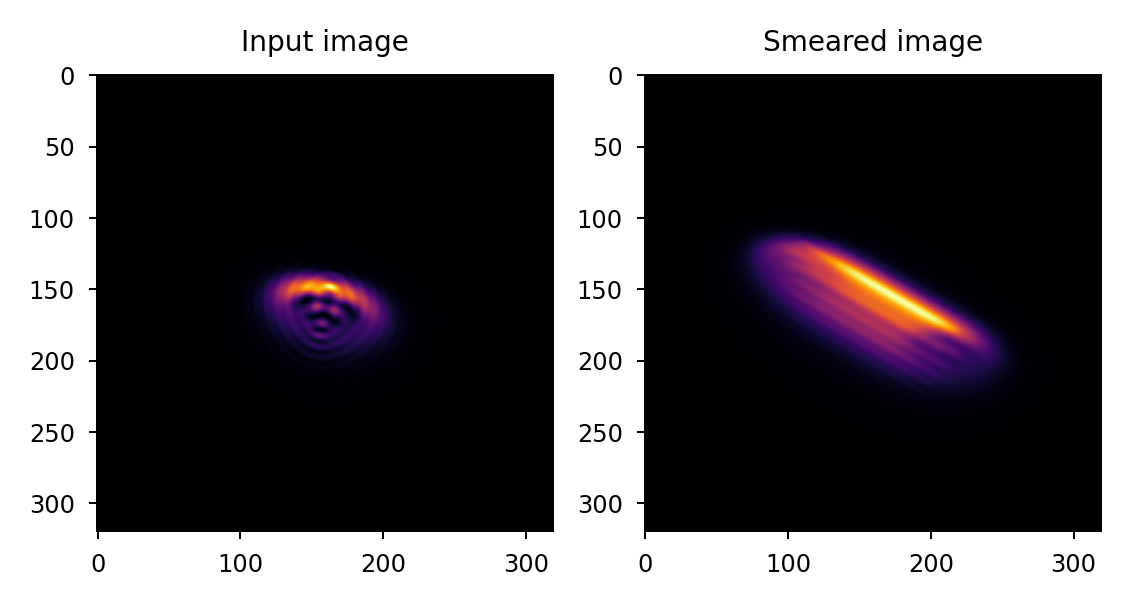
The default behavior is to choose a new random smear direction each time smear()
is called, but a static direction can optionally be specified as needed:
>>> import lentil
>>> import matplotlib.pyplot as plt
>>> psf = ...  # PSF calculation details omitted
>>> psf_smear = lentil.smear(psf, distance=25,
...                          angle=30)
>>> plt.subplot(121), plt.imshow(psf, cmap='inferno')
>>> plt.subplot(122), plt.imshow(psf_smear, cmap='inferno')
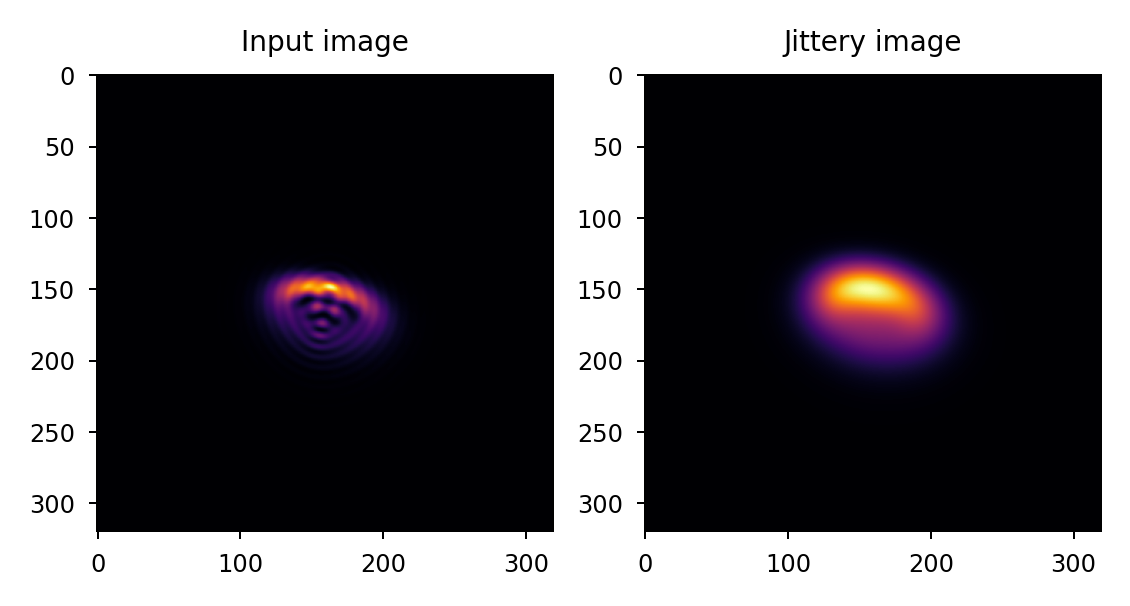
Jitter#
Jitter is used to represent image motion with a relatively high temporal frequency relative
to integration time. Lentil’s jitter() method represents jitter with a
Gaussian blur operation. Note this approach is only valid if the motion occurs randomly in all
directions during one integration time.
>>> import lentil
>>> import matplotlib.pyplot as plt
>>> psf = ...  # PSF calculation details omitted
>>> psf_jitter = lentil.jitter(psf, scale=2, oversample=5)
>>> plt.subplot(121), plt.imshow(psf, cmap='inferno')
>>> plt.subplot(122), plt.imshow(psf_jitter, cmap='inferno')
If the jitter being modeled is not sufficiently random during a typical integration time, a timeseries should be used instead. This can have a major impact on propagation performance but will provide the most accurate results.