Coordinate system#
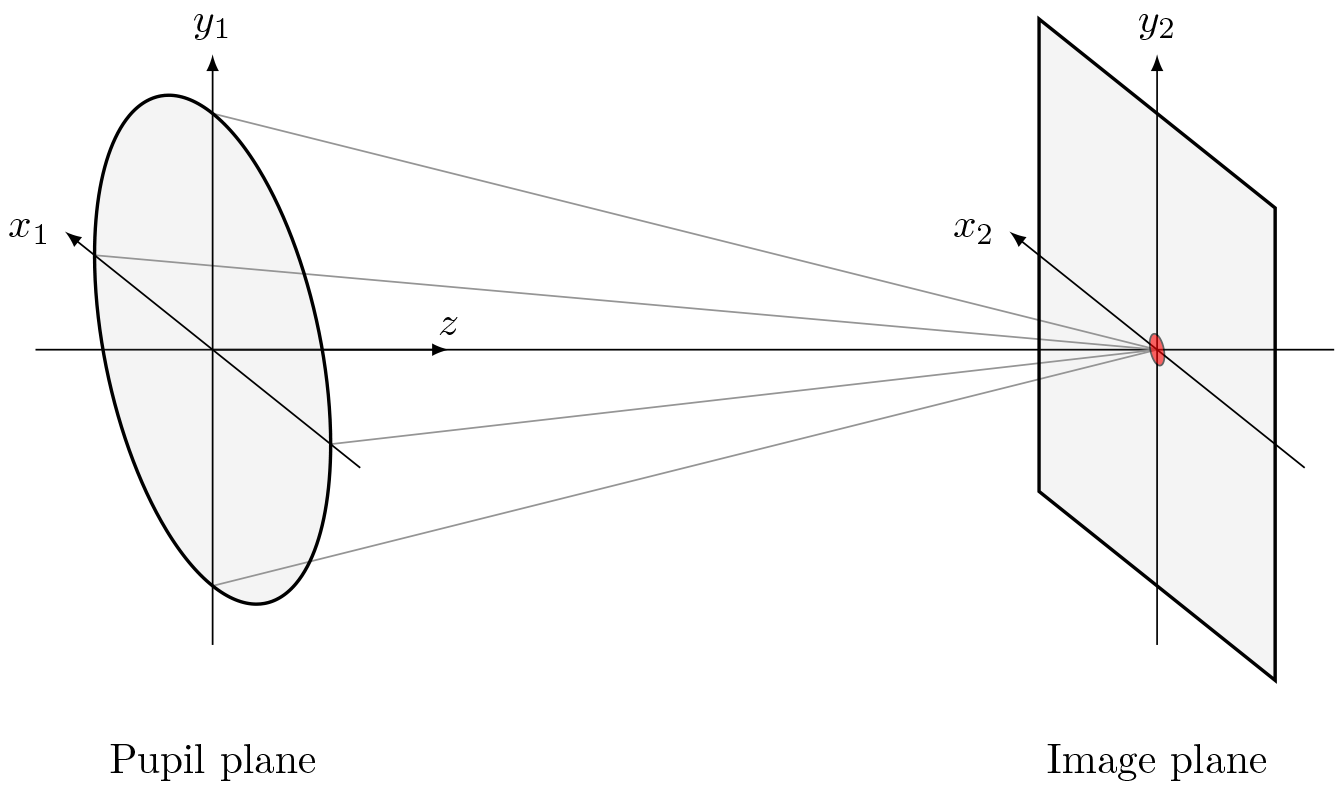
Lentil adopts the widely used convention of aligning the z-axis along the direction of light propagation through an optical system. For a right-handed coordinate system, it follows that the remaining axes are oriented as shown in the figure below:

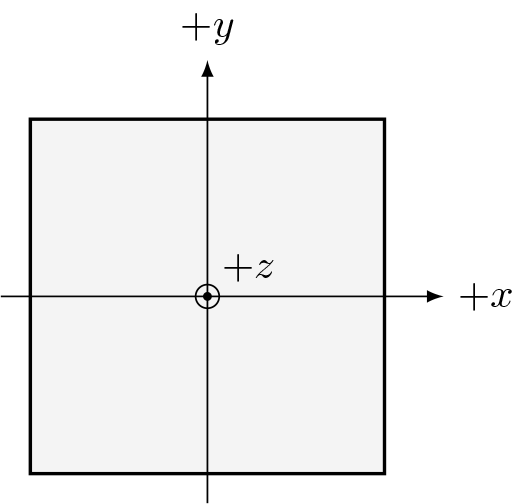
When viewing a plane in 2D, the z-axis comes out of the screen with the positive x-axis pointing to the right and the positive y-axis pointing up:

Additional details on the sign conventions for representing wavefront error and of the complex exponential in the Fourier kernel are provided below:
Note
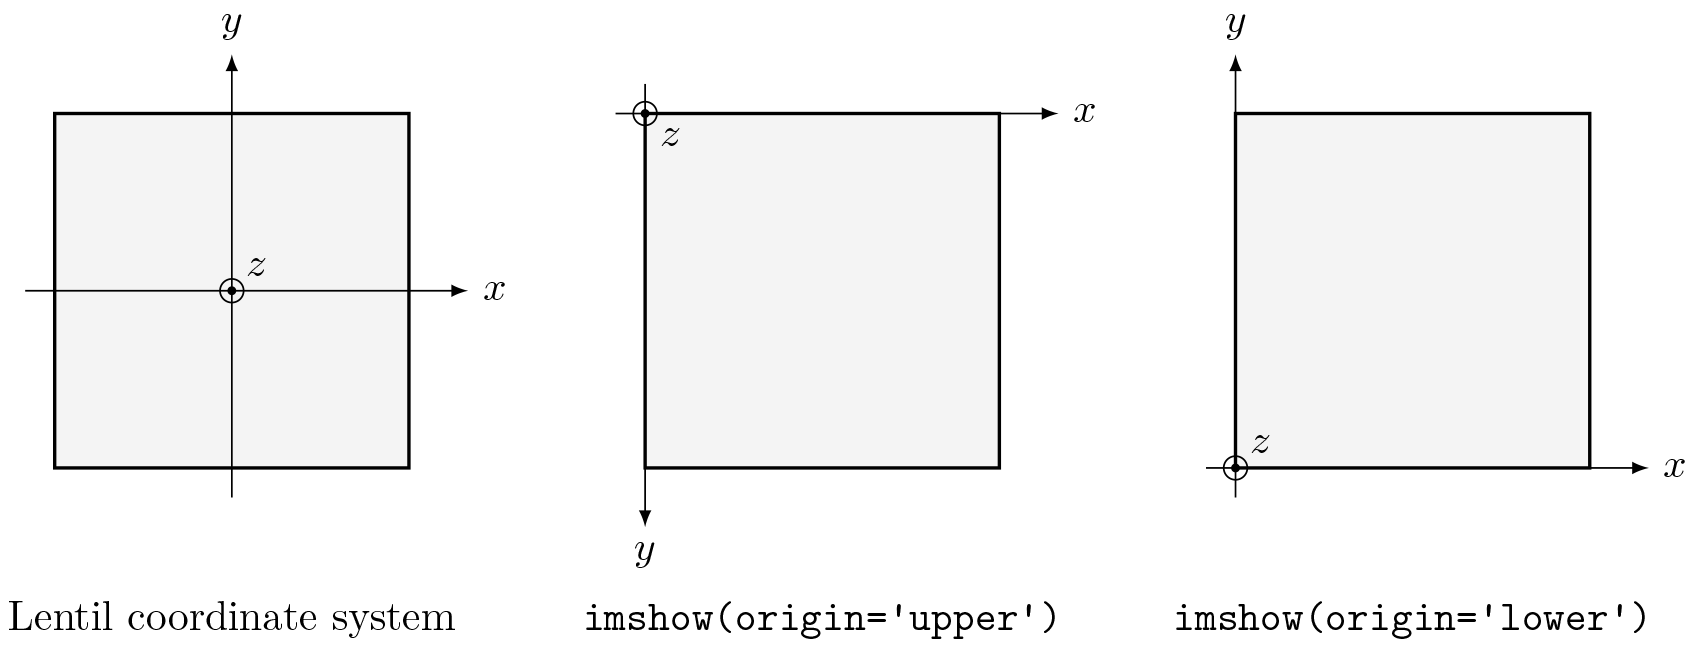
Matplotlib’s imshow() method (and MATLAB’s imagesc() method) place
the origin in the upper left corner of the plotted image by default. This presents
arrays in the standard (row, column) ordering. The result is that the direction of
y-axis is flipped relative to Lentil’s coordinate system. This doesn’t necessarily
present a problem as long as results are consistently plotted, but to be completely
correct (particularly when comparing model-generated images against intuition or
measured data) the origin should be located in the lower left corner of the
displayed image.
