Simple diffraction simulation#
import matplotlib
import matplotlib.pyplot as plt
import numpy as np
import lentil

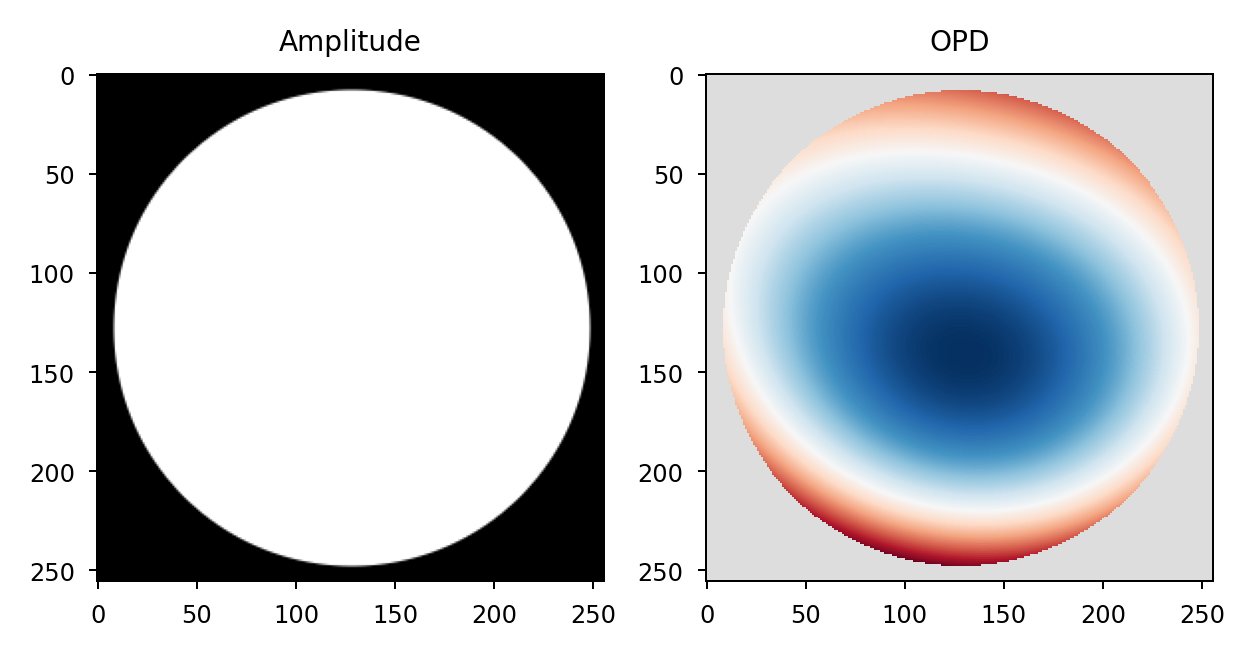
amp = lentil.circle(shape=(256,256), radius=120)
coef = [0, 0, 0, 300e-9, 50e-9, -100e-9, 50e-9]
opd = lentil.zernike_compose(mask=amp, coeffs=coef)

fig, (ax1, ax2) = plt.subplots(ncols=2, figsize=(5, 3))
ax1.imshow(amp, cmap='gray')
ax1.set_title('Amplitude')

# set up the OPD colormap to display NaNs as light gray
opd_plot = opd.copy()
opd_plot[np.where(opd_plot == 0)] = np.nan
opd_cmap = matplotlib.colormaps.get_cmap('RdBu_r')
opd_cmap.set_bad(color='#dddddd')
ax2.imshow(opd_plot, cmap=opd_cmap)
ax2.set_title('OPD')

# pupil model of the optical system
pupil = lentil.Pupil(amplitude=amp, opd=opd, pixelscale=1/240,
                     focal_length=20)

# create a plane wave
w0 = lentil.Wavefront(wavelength=500e-9)

# propagate wavefront through pupil plane
w1 = w0 * pupil

# propagate the wavefront to the image plane
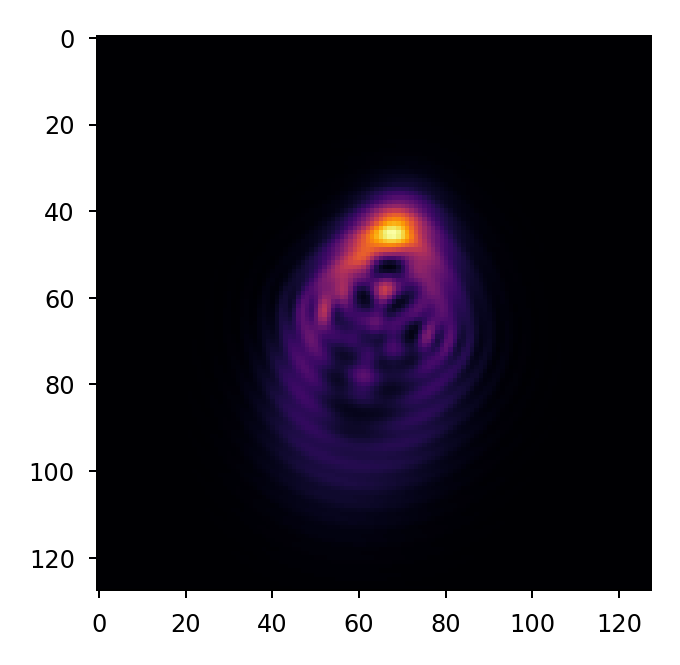
w2 = lentil.propagate_dft(w1, shape=(64,64), pixelscale=5e-6, oversample=2)

# plot the oversampled PSF
fig, ax = plt.subplots(figsize=(2.5, 2.5))
ax.imshow(w2.intensity, cmap='inferno')

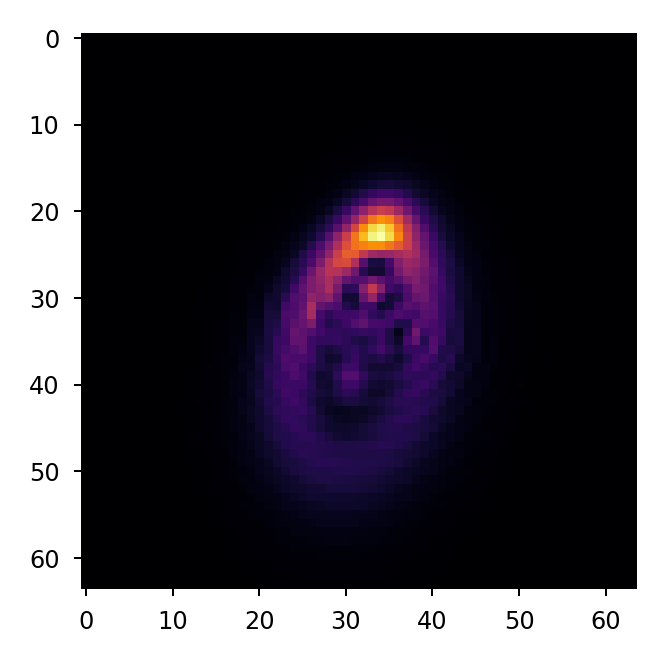
# convolve the oversampled PSF with the pixel MTF and rebin to
# native sampling
img = lentil.detector.pixelate(w2.intensity, oversample=2)
fig, ax = plt.subplots(figsize=(2.5, 2.5))
ax.imshow(img, cmap='inferno')
