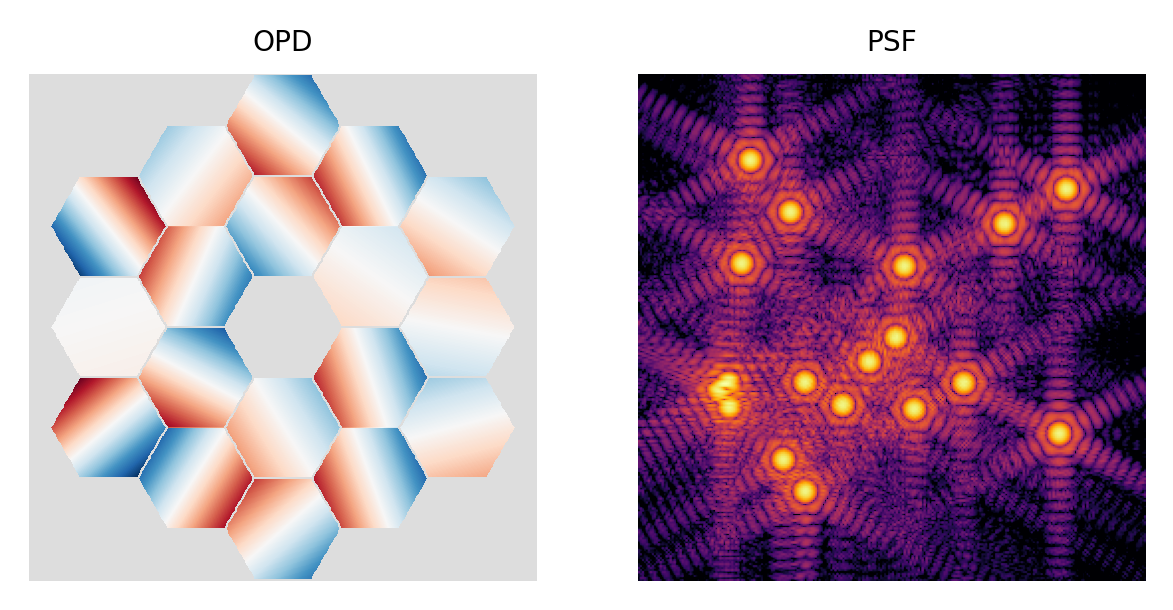
import lentil
import matplotlib
import matplotlib.pyplot as plt
import numpy as np

segmask = lentil.hex_segments(rings=2, seg_radius=64, seg_gap=2, flatten=False)

# the amplitude is the flattened set of segmasks
amp = np.squeeze(np.sum(segmask, axis=0, keepdims=True))

# generate random segment tilts
opd = 0
for seg in segmask:
    coeff = np.random.uniform(-1, 1, 2)*3e-6
    opd += lentil.zernike_compose(seg, [0, *coeff])

# do the propagation
p = lentil.Pupil(amplitude=amp, opd=opd, focal_length=10, pixelscale=1/240)
w = lentil.Wavefront(650e-9)
w = w * p
f = lentil.propagate_dft(w, pixelscale=5e-6, shape=(128, 128), oversample=2)
psf = f.intensity

# set up the OPD colormap to display NaNs as light gray
opd[np.where(opd == 0)] = np.nan
opd_cmap = matplotlib.colormaps.get_cmap('RdBu_r')
opd_cmap.set_bad(color='#dddddd')

fig, (ax1, ax2) = plt.subplots(nrows=1, ncols=2, figsize=(5,3))

ax1.imshow(opd, cmap=opd_cmap)
ax1.set_title('OPD')
ax1.axis('off')

ax2.imshow(psf, cmap='inferno', norm='log', vmin=5e-3)
ax2.set_title('PSF')
ax2.axis('off')
